Report Presentation Templates: Marketing & Performance Decks That Tell a Clear Story
Report presentation templates help you turn numbers into decisions with a clean flow: goals → highlights → KPIs → insights → actions. Use this page to choose the right marketing report template or business reporting deck type, follow a proven structure, and keep slides easy to scan for busy stakeholders.
Why report presentation templates work
Reports land better when the audience can answer two questions fast: “What changed?” and “What do we do next?” A strong template keeps slides consistent, puts insights next to the metrics, and guides the conversation toward decisions rather than screenshots.
- Clear story: goals → results → insights → actions.
- Faster reading: one takeaway per slide, with scannable headings.
- More trust: consistent charts, clean spacing, and repeatable KPI layouts.
- Better alignment: decisions and owners are obvious at the end.
Report presentation template types
Choose the deck based on what you’re reporting and who needs the update. Then keep the same KPI definitions across the deck, so comparisons feel reliable.
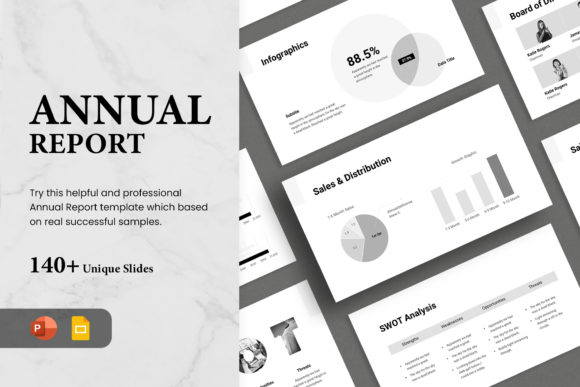
Marketing report decks (campaign & performance)
- Best for: paid ads, SEO, email, social, content performance.
- Key slides: goals, spend & ROI, channel KPIs, wins, opportunities, next actions.
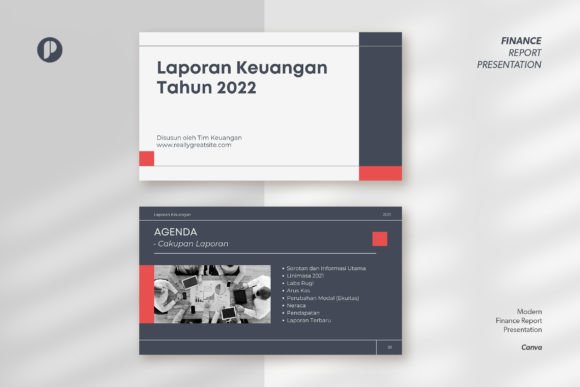
KPI / executive summary decks
- Best for: leadership updates where time is limited.
- Key slides: highlights, KPI table, variances, decisions needed, risks.
Sales pipeline & forecast reports
- Best for: pipeline reviews, forecast calls, quarterly planning.
- Key slides: pipeline health, stage conversion, top deals, forecast vs target, next steps.
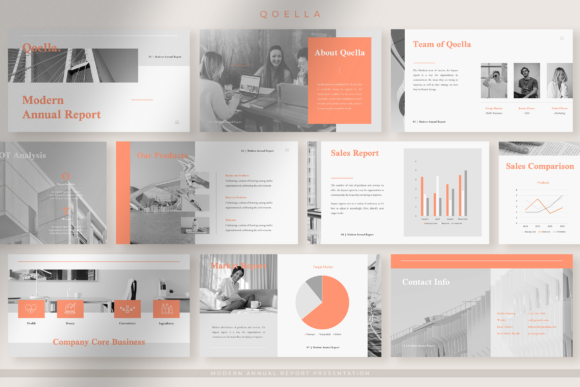
Client reporting (monthly/QBR)
- Best for: agencies and service providers reporting outcomes.
- Key slides: objectives, deliverables, KPI progress, insights, recommendations, roadmap.


Best report presentation structure
This order keeps the report decision-focused. If you have heavy data, push detail into an appendix and keep the core deck clean.
- Title + timeframe: what period you’re reporting.
- Goals: what success looked like for this period.
- Executive highlights: 3–5 wins or key changes.
- KPI snapshot: top metrics + variance vs last period/target.
- Insights: what caused the change (not just what changed).
- Recommendations: what to do next and why.
- Action plan: owners, dates, and priorities.
- Appendix: breakdowns, extra charts, definitions.
Must-have slides for marketing & business reports
- Executive summary: the takeaway in one screen.
- KPI table: metric, current, previous, target, variance.
- Trend chart: one clear visual for the main KPI.
- Insights slide: the “why” behind results (3–5 bullets).
- Next actions: what changes next period, with owners.
Copy formulas that fit report decks
- Result: “We increased [KPI] by [X%] vs last period.”
- Cause: “This change was driven by [Reason 1] and [Reason 2].”
- Recommendation: “Next, we should [Action] to improve [KPI].”
- Decision ask: “Approve [Plan] by [Date] to hit [Target].”


Quick checklist (before you present)
- One takeaway per slide: headings should be conclusions, not topics.
- Define KPIs once: keep metric names consistent across slides.
- Use fewer charts: 1–2 visuals per slide beats a dashboard screenshot.
- Show variance: vs last period and vs target (if you have one).
- End with action: owners + dates + the decision you need.
Recommended picks
Start with a clean reporting style and reuse the same KPI slide pattern. Then tighten the executive summary so it reads well even if someone only sees the first two slides.
Marketing Report Decks
Channel KPIs, ROI slides, insights, and next actions in a clean flow.
View options →KPI / Executive Summary Slides
Simple KPI tables, variances, and decision-ready summary layouts.
View options →Client Report Presentations
Objectives → results → insights → recommendations, built for clients.
View options →Charts & Dashboard Slides
Clean chart layouts and dashboard-style slides for quick KPI reviews.
View options →FAQ
How long should a report presentation be?
Short enough to stay decision-focused. For most updates, 8–15 slides works well, plus an appendix for deep dives and extra charts.
What should I include in a marketing report deck?
Start with goals and a summary, then show the KPIs that matter (spend, revenue/ROI, leads, CAC/CPA, conversion rate). After that, add 3–5 insights and a clear next-period plan with owners.

Related presentation hubs
Business Presentation Templates
Meeting-ready decks for strategy, proposals, and internal updates.
Explore →Education Presentation Templates
Lesson slides and classroom decks for teaching and student work.
Explore →Next step
Pick the report type that matches your audience, then write the executive summary first. Next, build a KPI snapshot slide and an insights slide before adding extra charts. Finally, end with a short action plan that names owners and dates.